Understanding Trader Performance in BloFin Copy Trading
February 6, 2026 at 07:34 PMYour profile page provides a clear overview of your portfolio’s performance.
Indicator | Description |
PnL | Realized + Unrealized Profit or Loss |
| Return on Investment (ROI) | A metric that measures the profitability or efficiency of the portfolio. Formula: ROI = [PnL / Maximum Account Base Balance]
|
Sharpe Ratio | Measures a portfolio’s return relative to its risk. A higher Sharpe Ratio indicates a more attractive risk-adjusted return. Formulas: Sharpe Ratio = Annualized Return / Annualized Volatility
|
Maximum Drawdown (MDD) | Maximum Drawdown (MDD) measures the largest decline in net asset value from a peak to the subsequent trough over a given period. A higher MDD indicates greater risk. Formula: MDD = (Current ROI - Highest Recorded ROI) / (1 + Highest Recorded ROI)
|
Win Rate | The ratio of the number of trades realizing profit to the total number of trades. Formula: Number of Profitable Closed Positions / Total Number of Positions * 100%
|
Assets Under Management (AUM) | Lead Trader's Investment Amount + Total Copy Trading Investment Amount |
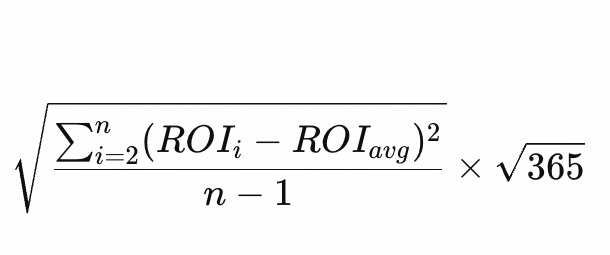
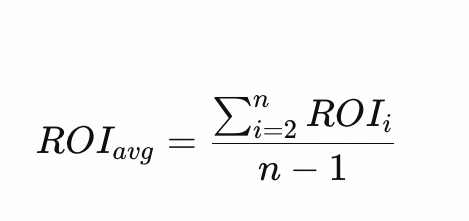
Volatility | Measures how much a trader’s trading performance fluctuates over a period of time. Formula: 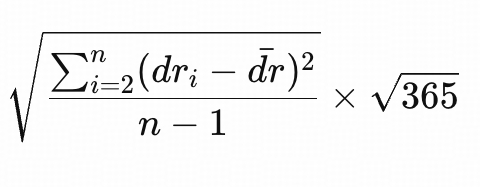 |
Low Volatility | Indicates that a trader’s performance experiences relatively small fluctuations, reflecting a more stable and conservative trading style. |
Calmar Ratio | Measures a trader’s return relative to the maximum drawdown over the same period. A higher Calmar Ratio indicates better return performance with stronger drawdown control. Formula: Calmar Ratio = ROI / Maximum Drawdown |
Sortino Ratio | Measures a trader’s return relative to the downside risk of their trading performance. A higher Sortino Ratio indicates better returns with lower downside risk. Formula: Sortino Ratio = (Average Daily Return × 365) / Downside Risk
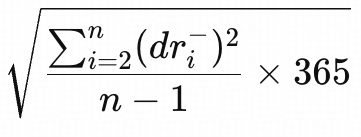 |
Trader Tags
Tag Name | Definition |
Top ROI | Top 15 Traders that have earned the highest ROI in the last 30 days. |
Top Profit | Top 15 Traders that have made the highest return for Copiers. |
Low Risk | Traders that have made the lowest Maximum Drawdown in the last 30 days. |
Rising Star | New traders with high ROI in the last 7 days. |
High Frequency | Traders who have traded more frequently than other Lead Traders in the last 30 days. |
Low Frequency | Traders who have traded less frequently than other Lead Traders in the last 30 days. |
High Leverage | Traders whose average leverage used in the last 30 days is above 20X. |
Low Leverage | Traders whose average leverage used in the last 30 days is below 10X. |
Was this article helpful?